My Euro 2020 work consisted of a series of Tableau visualizations, a lot of Python code, and a set of ...
Football Analytics
All My Euro 2020 Work in One Post
July 11, 2021
Using K-Means Clustering to Model Progressive Passing Data in Football
May 13, 2021
Explaining Mason Greenwood’s Struggle for Consistent End Product this Season
April 14, 2021
I really enjoyed combining Python, Tableau, and some video analysis to write about Mason Greenwood’s form this season and what it means moving forward. Hope you enjoy!
Animating a Tableau Dashboard: Rolling Metric Performance of Premier League Teams, 2020/21
February 5, 2021
The Tableau Dashboard linked below allows you to filter for teams and view an animation of Premier League team trends from Gameweeks 1-20 this season. By animating this data from FBRef.com, I was able to really get a good sense of how team form evolves over time.
The Dashboard will allow you to filter specifically for the teams whose data you wish to see.
Unfortunately, animations have very high runtime on Tableau Public, which likely makes other data visualization tools better for animating trends, even if Tableau is easier to work with.
Made in Excel and Tableau
Tableau Dashboard: Shot-Creating Actions of Premier League Teams, 2020/21
February 1, 2021
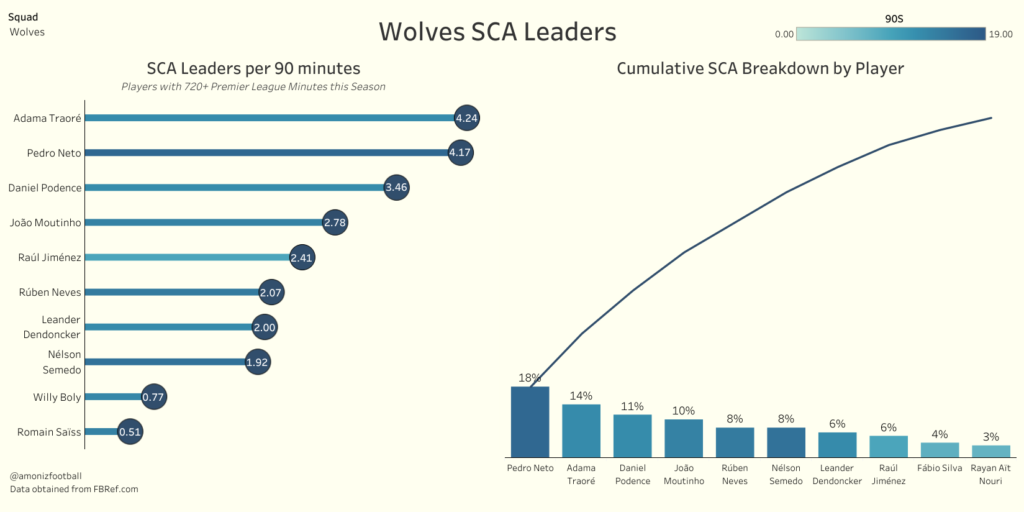
Last week, I created a Tableau Dashboard that presents a Lollipop and Pareto chart breaking down team shot-creating actions by player in the 2020/21 Premier League season.
Shot-Creating Actions measure the action that occurs directly before a shot, essentially attempting to holistically measure player creativity and involvement in a team’s attacks. It is not a metric without flaws, but it will give a general indicator of how involved a single player is in their side’s overall offensive output.
You can view the dashboard and generate your own vizzes at the link below:
Made in Excel and Tableau
Tableau Dashboard: Rolling xG Trends of Premier League Teams, 17/18-20/21
January 10, 2021
Squad Minutes Breakdown in Python
January 4, 2021
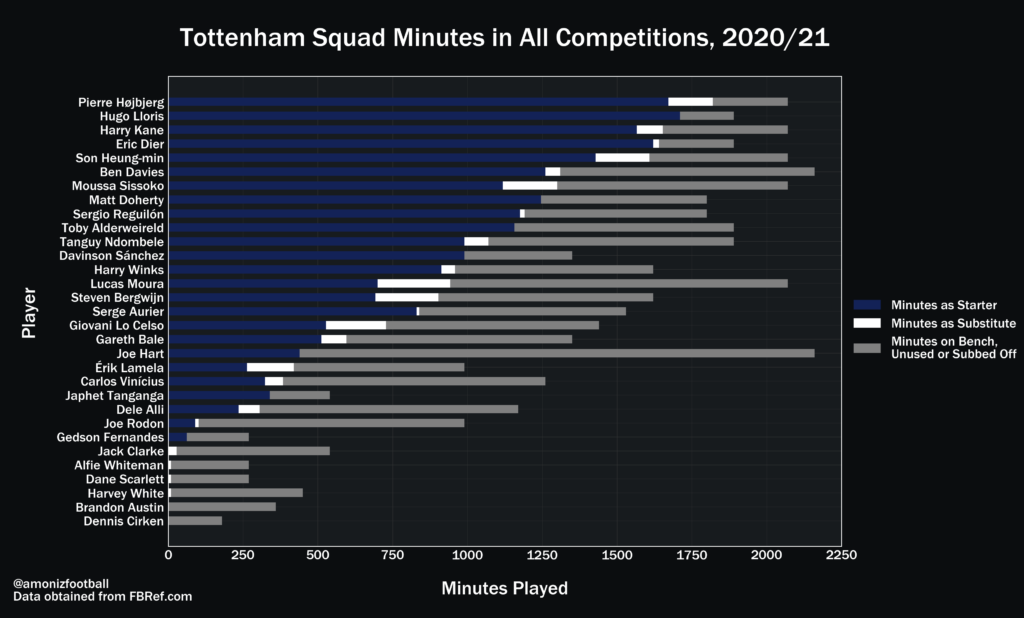
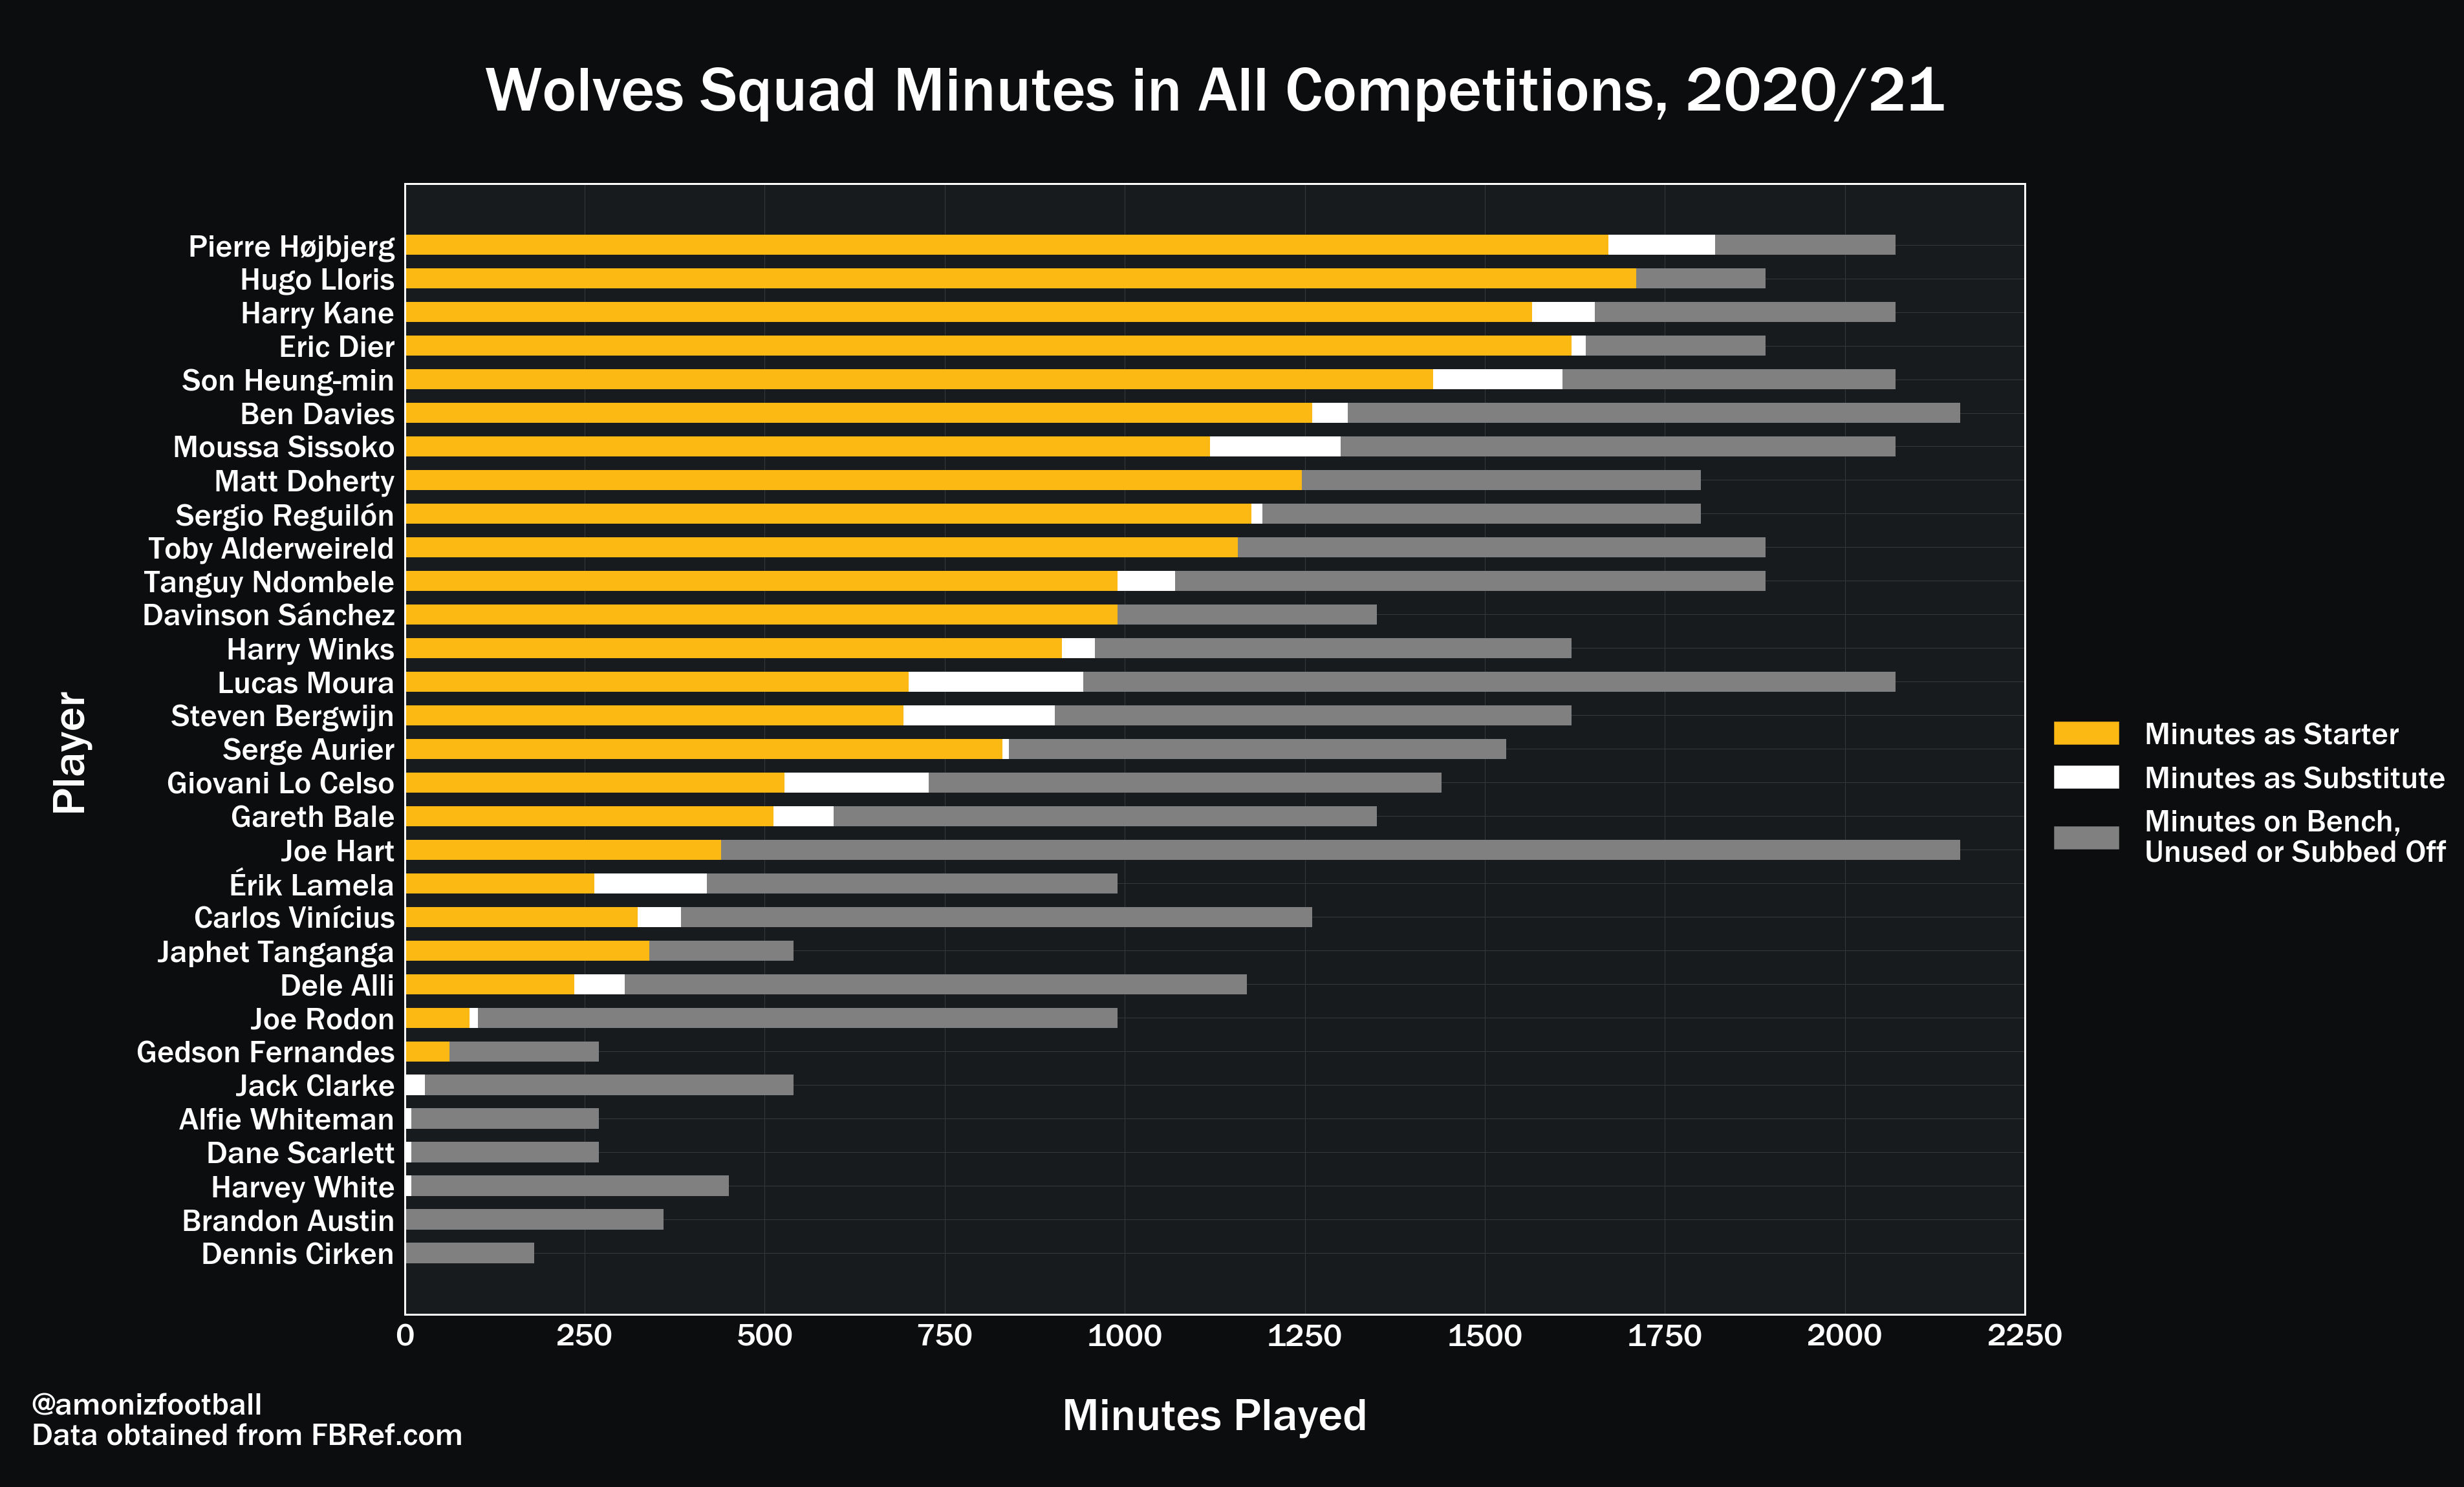
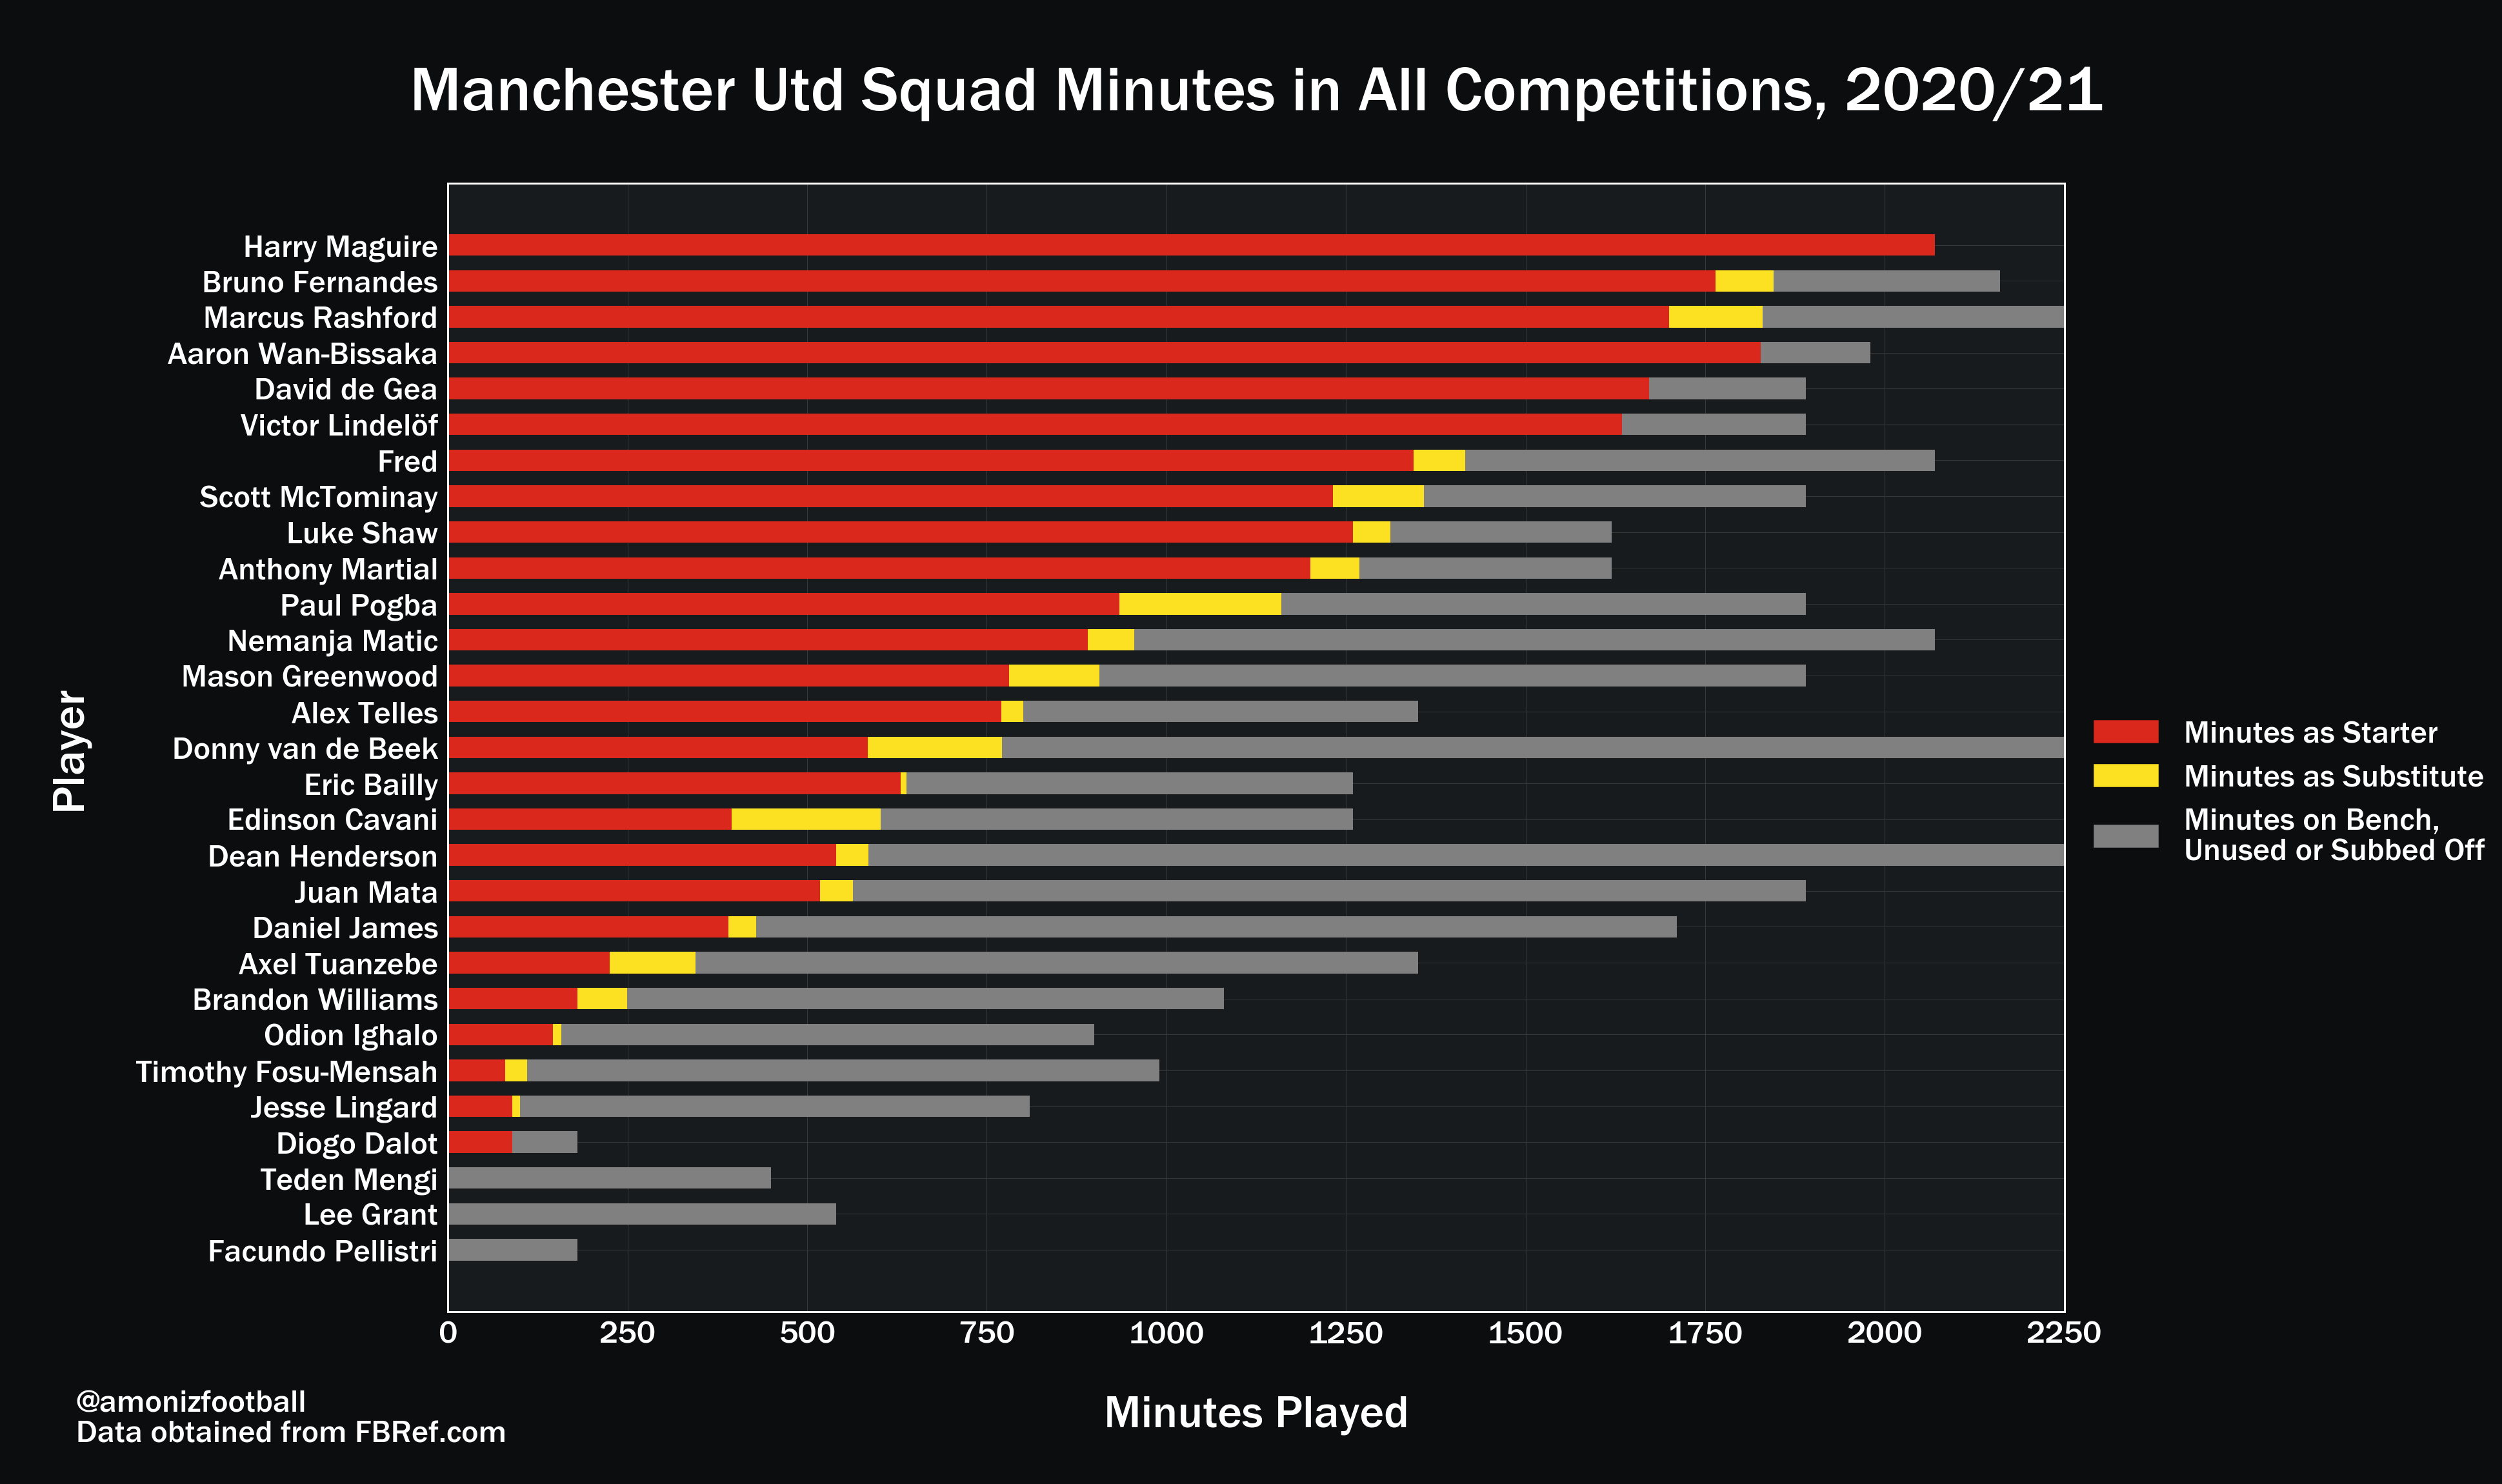
This Github repo contains Python code designed to generate a breakdown of Premier League team minutes by player for a club in the form of a horizontal stacked bar graph. The Excel file attached in the folder provides primary and secondary colours of Premier League clubs optimized for black backgrounds.
Feel free to use either for your own projects!
Made in Matplotlib, Numpy, Pandas, and Jupyter Notebooks
Using Python to Filter and Plot Categorized Pass Maps
November 21, 2020
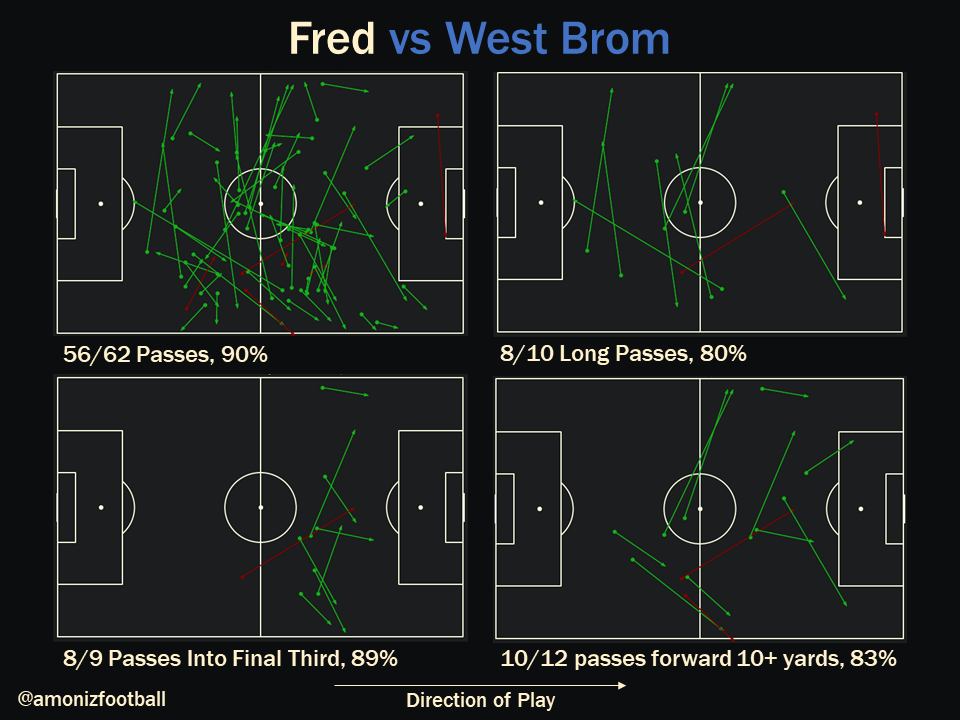
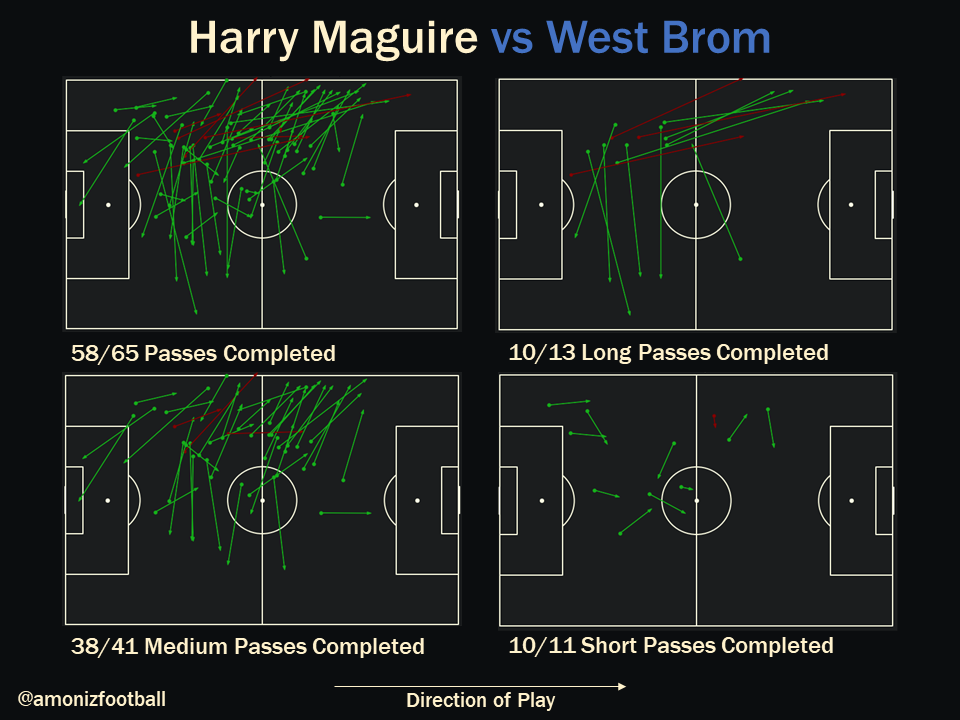
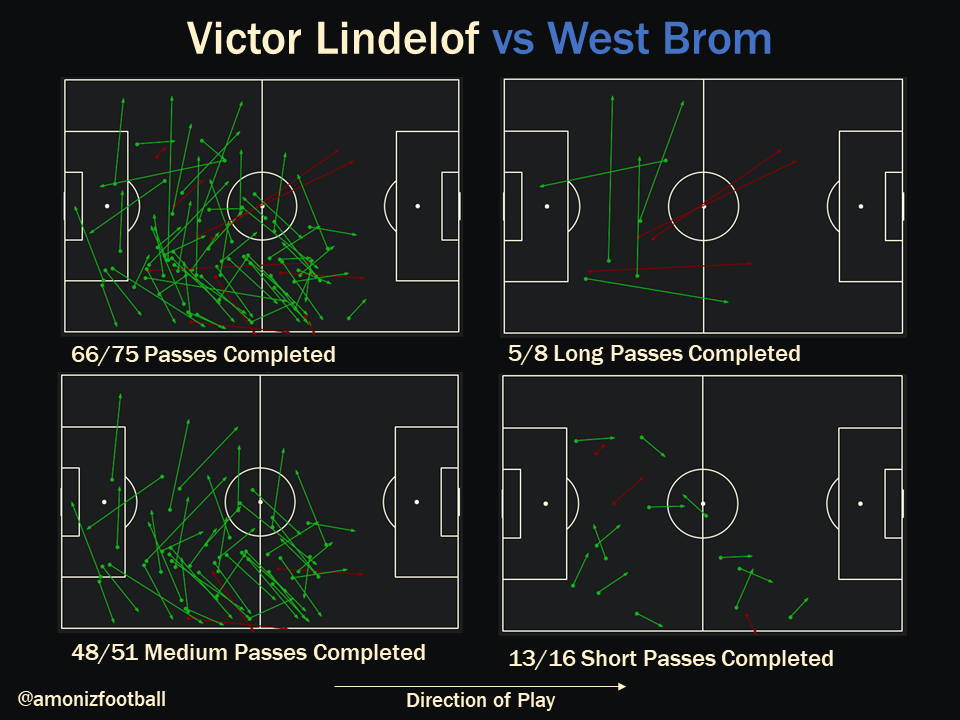
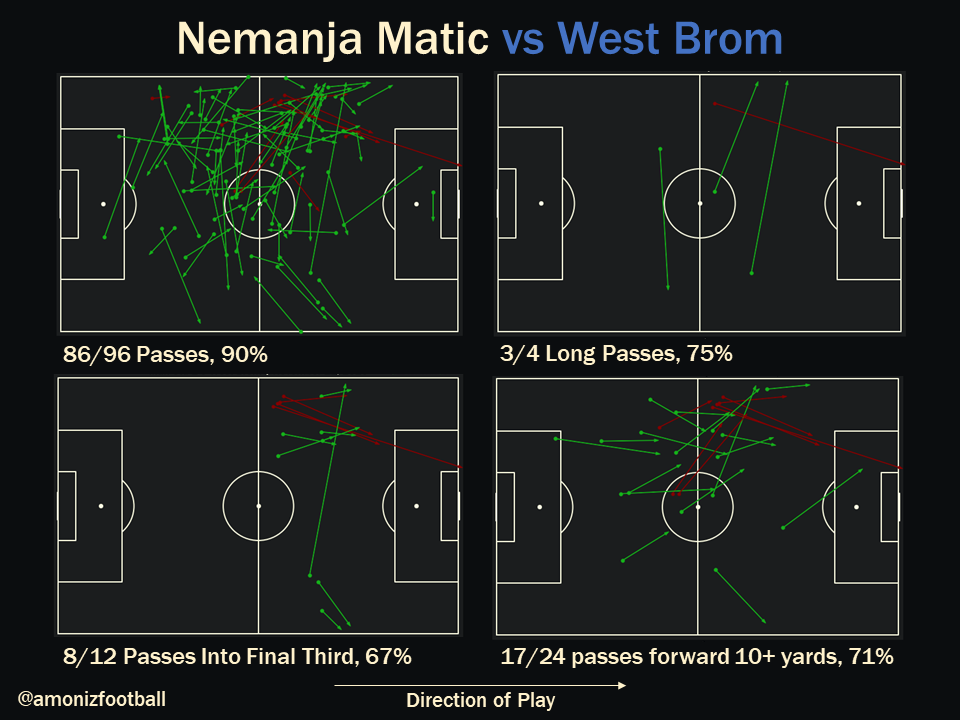
By establishing definitions of different types of passes and filtering for them in Pandas, I was able to create pass maps which break down specific types of passes that players make in a game.
A frequent criticism of pass maps is that they offer no analytical value and are more for aesthetic view. These maps are far from comprehensive answers to that, but they begin to reveal some trends in the types of passes certain players make in matches. For example, two clear trends can be spotted in Maguire’s long pass map (slide 2)- passes stretching to the right-back territory, and higher-risk passes over to the left-wing to pick out Marcus Rashford.
Made in Matplotlib, Numpy, Pandas, Jupyter Notebooks, and PowerPoint
Touch Locations: Manchester United’s Starting XI in the Premier League, 2019/20
September 25, 2020
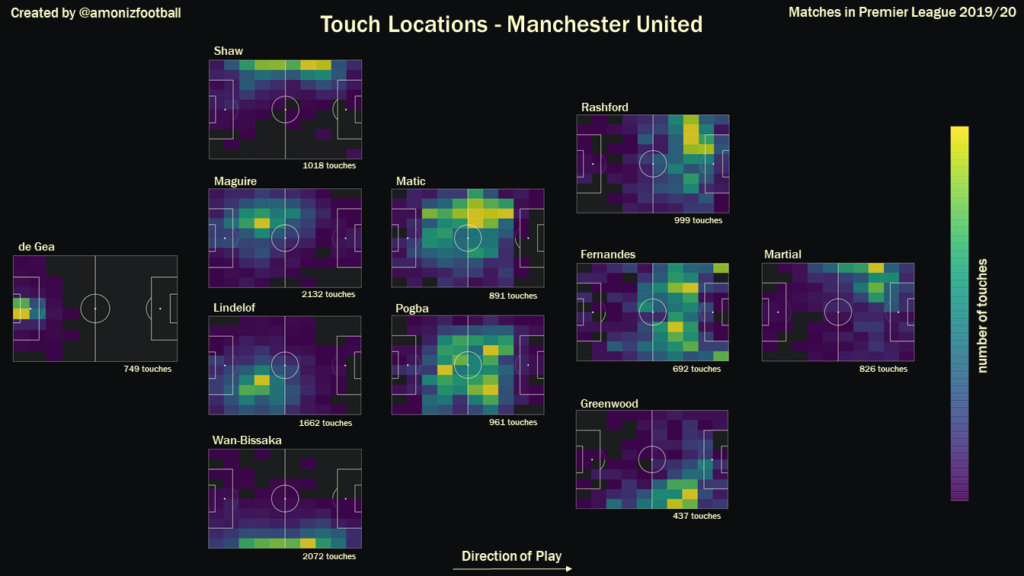
Expanding upon yesterday’s visualization, I have broken down Manchester United’s touches per season by individual player.
Harry Maguire and Luke Shaw have a lot more presence on the ball than their mirrored counterparts. Perhaps moving Maguire to the right and adding a left-footed centre-back could help United’s wing imbalances. There needs to be a specific plan to compensate for the shortcomings in Aaron Wan-Bissaka’s game if we are to continue to see his best form.
Nemanja Matic spends a lot more time in the final third than he should. A 4-3-3 with him occupying the defensive and middle thirds might suit the player’s skillset better, while also allowing Paul Pogba to play in more creative areas.
Marcus Rashford gets into the box more than Anthony Martial, who leans very far to the left. Getting players into the box consistently seems to be an issue for Solskjaer’s United.
Made in Matplotlib, Numpy, Pandas, Jupyter Notebooks, and PowerPoint
Touch Locations: Manchester United in the Premier League, 2019/20
September 24, 2020
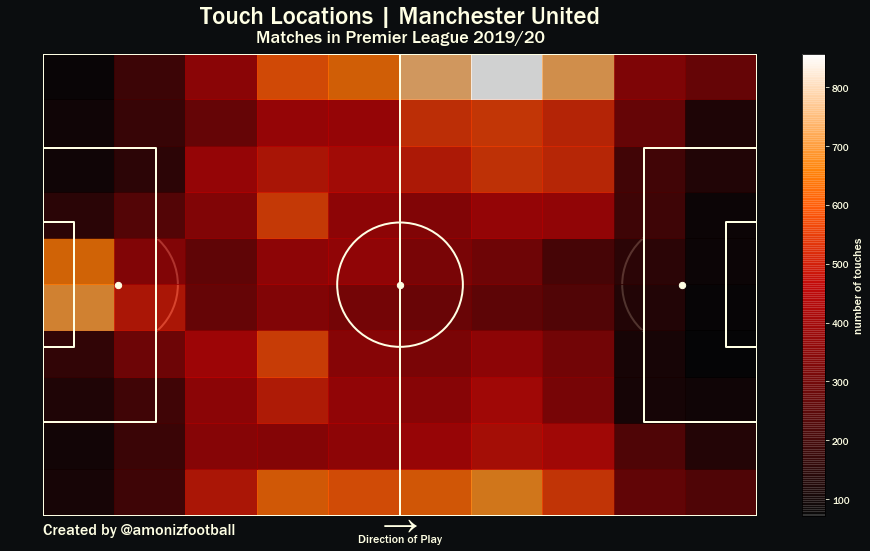
Above is a 2d-histogram of each of the 36,724 ball touches made by a Manchester United player in the Premier League last season.
We notice most prominently the imbalance between United’s left and right flanks. Luke Shaw (left-back) and Marcus Rashford (left-wing) have established themselves as much more reliable outlets than Aaron Wan-Bissaka (right-back) and Mason Greenwood (right-wing) and as such receive the ball more.
This discrepancy also highlights the left-sided bias of some of United’s more central players. Anthony Martial, a left-winger before last season, tends to shift towards the left channel naturally in his game, whereas Nemanja Matic has a low and left-biased passing range as a result of his left-footednes.
Overcrowding one wing and not using the other enough makes United more predictable and easier to defend against, because, in simple terms, opponents will feel they have less space on the pitch to cover to mark United’s players.
Through making truth of rumours of a right-winger signing this summer, United could definitely improve their balance between flanks. Perhaps a left-footed centre-back would also allow Harry Maguire (left-sided centre-back who is right-footed), a player who is integral to United’s buildup, to shift over to the right side and help reduce the imbalance between the flanks.
Made in Matplotlib, NumPy, Pandas, and Jupyter Notebooks
Pass Maps: Everton 5-2 West Brom
September 19, 2020
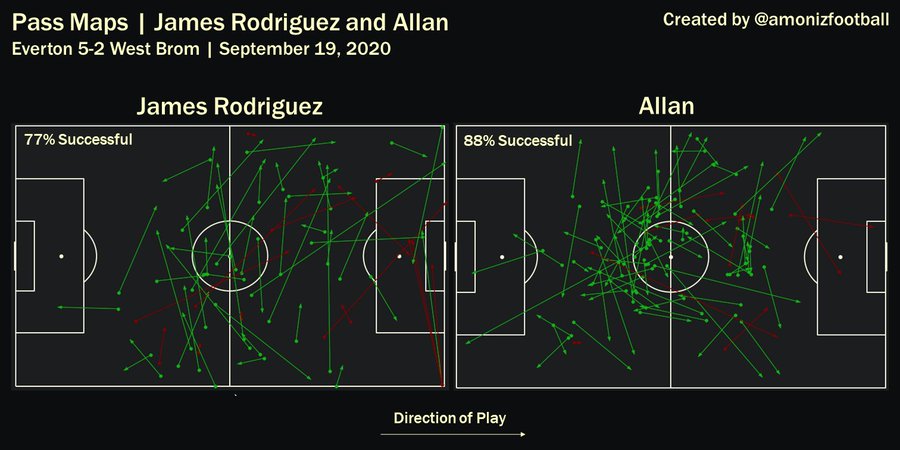
Everton managed to pull off the signings of two top-level European midfielders, capturing James Rodriguez from Real Madrid and Allan from Napoli.
Both players have already become vital figures at Goodison Park despite playing just two games for Everton. As highlighted in the pass map above, James Rodriguez is a creative star with a silky passing range, and Allan’s short and simple progressive passing in the middle of the park enables Everton’s swift transition from one side of the pitch to the other.
Made in NumPy, Pandas, Matplotlib, Jupyter Notebooks, and PowerPoint
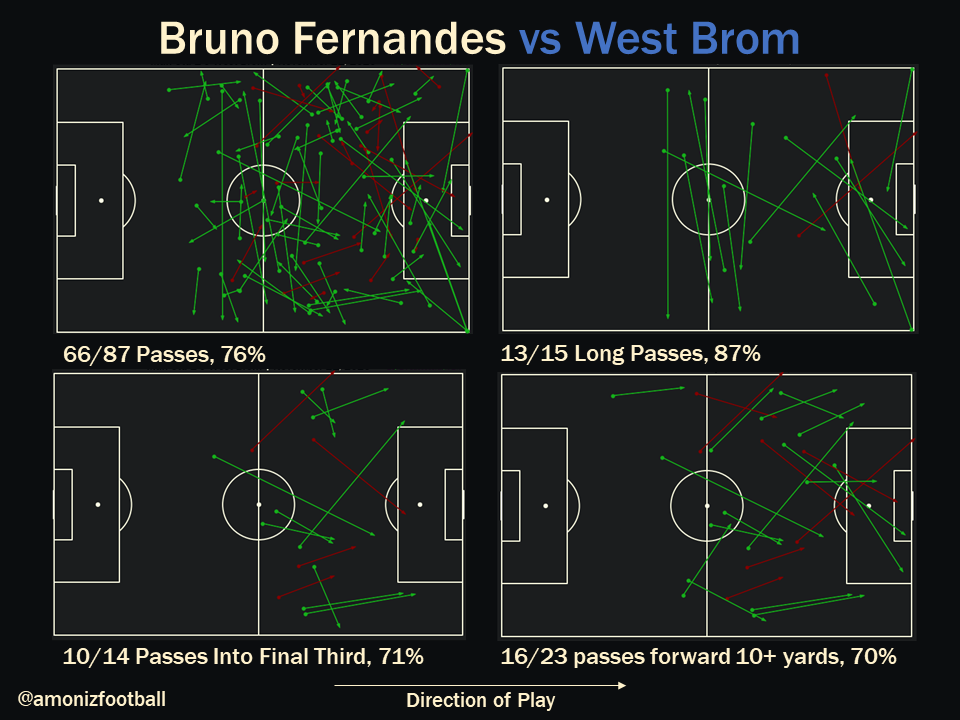
Pass Locations: Manchester United Midfielders in the 2019/20 Premier League
September 17, 2020
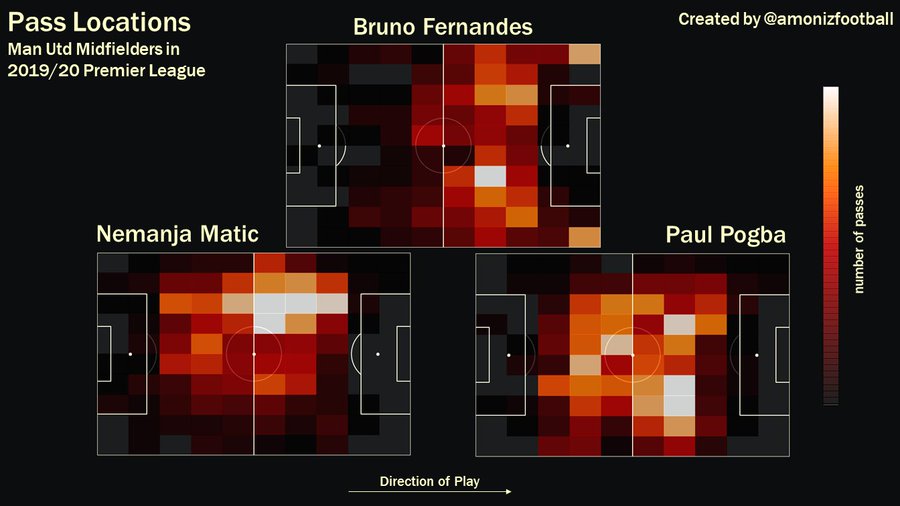
Above are the pass start locations for every pass made by Nemanja Matic, Paul Pogba, and Bruno Fernandes, Manchester United’s first-choice midfielders, in the Premier League last season.
Bruno Fernandes, often criticized for the number of turnovers he incurs, could benefit from playing in a slightly deeper role where he is also more involved in buildup play.
Nemanja Matic and Paul Pogba, playing at the base of the midfield, are far too lateral for their strengths; Pogba tends to excel in creative areas, while Matic is more often a defensive midfielder.
As such, changing to a system where Pogba and Fernandes share the defensive load of the second midfielder, with Matic holding them together, would be more likely to place all three players in their best areas of the pitch.
Made in NumPy, Pandas, Matplotlib, Jupyter Notebooks, and PowerPoint
Special Piece: Python Data Visualization and Video Thread: Why Manchester United should not allow Sergio Reguilon to join Spurs so easily
The following is a data analytics thread done entirely in Python. The work is supplemented by video analysis of players. I hope you enjoy this piece.
Mateo Kovacic’s Progressiveness Makes Him Very Important to Chelsea
August 25, 2020
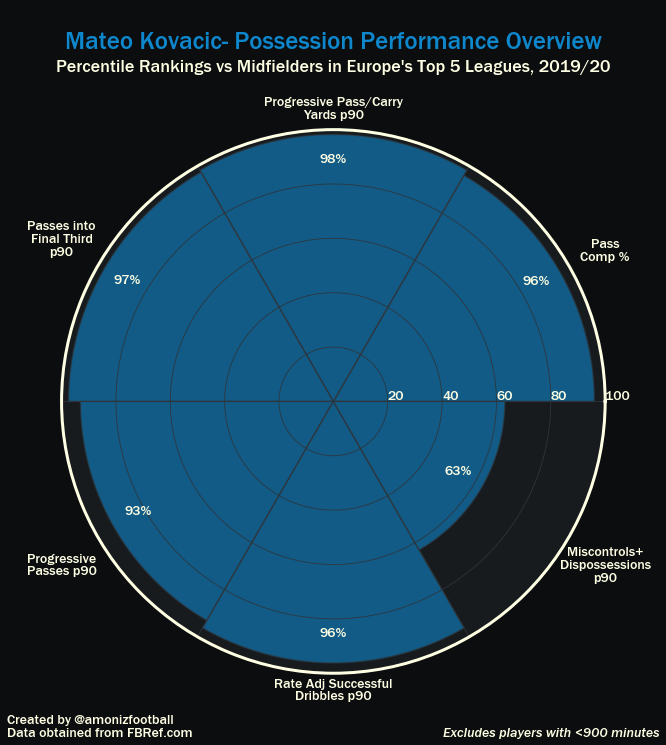
Chelsea have signed a number of world class prospects in the last few months, with German sensation Kai Havertz rumoured to be joining Timo Werner and Hakim Ziyech at the club. However, Mateo Kovacic, who rose to prominence in his second season at the club last campaign, remains their most important player.
The new signings guarantee that Chelsea will be a very attack-oriented side that tends to take risks on the ball and, as a result, lose it a lot. Kovacic developed a reputation as one of the best ball progressors in Europe’s Top 5 Leagues, and the best at Chelsea by a distance, which means he is likely to be crucial to them as a safe and reliable outlet to move the ball into attacking areas.
Great forwards are important to any side, but they need to receive the ball in prime areas of the pitch to reach their maximum heights. Kovacic will play a vital role in ensuring the likes of Werner, Ziyech, and potentially Havertz are able to do exactly that next season.
Made in NumPy, Pandas, Matplotlib, and Jupyter Notebooks
Data Visualization: Creating Percentile Polar Axis Charts in Python
August 25, 2020
An Application of the Project I have been working on…
August 24, 2020
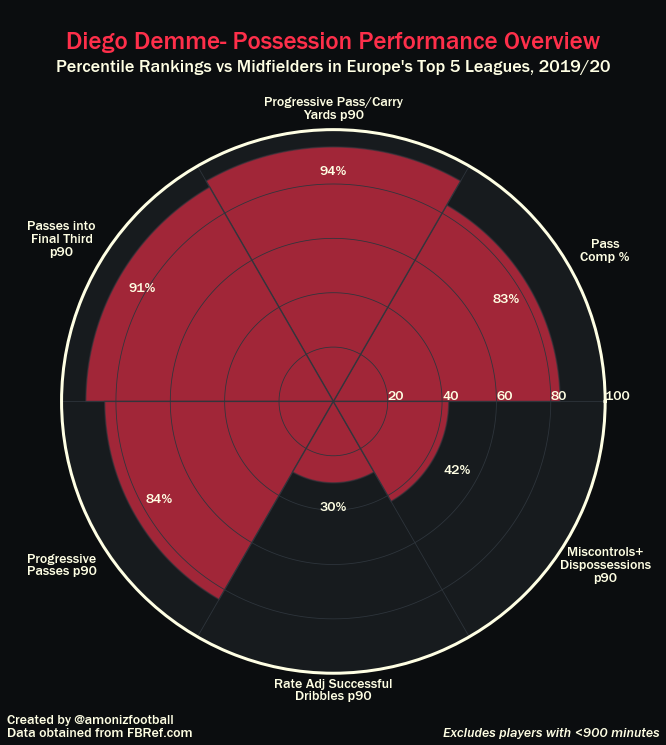
Tomorrow, I will release a project that will generate possession percentile ranking charts in Python for any midfielder in Europe’s Top 5 Leagues within seconds. Today, I noticed an application of it…
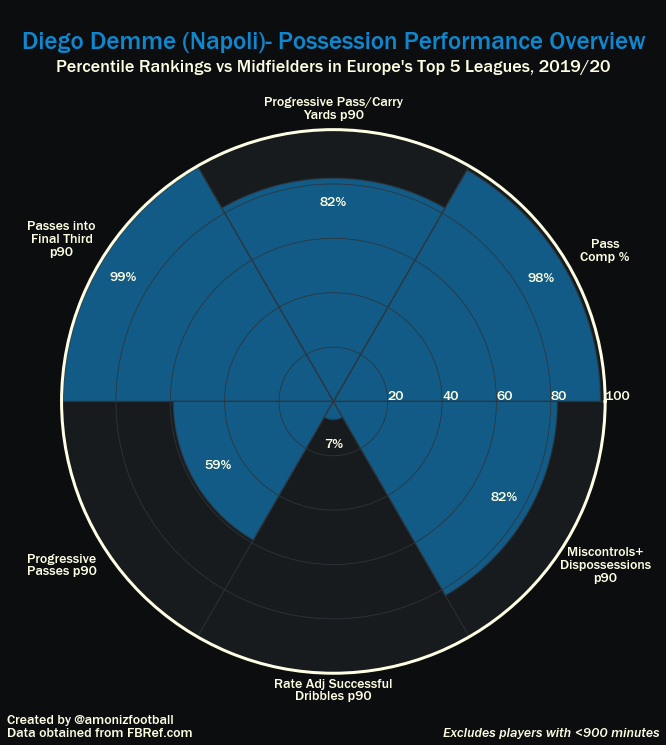
Diego Demme moved clubs from RB Leipzig to Napoli half way through last season, and we can see from his distinct possession percentile charts that his role in each side was different.
Demme was an ambitious ball progressor at RB Leipzig, as evidenced by his elite Progressive Passes, Passes into the Final Third, and Progressive Yards per 90 metrics, whereas at Napoli, he improved his accuracy and focused simply on short range passes into and around the final third.
This presents a useful application; it is a clear way to determine how a player’s role changes over time, or how their performance changes given a new role or club.
Made in NumPy, Pandas, Matplotlib, and Jupyter Notebooks
Thiago and Marco Verratti in the UEFA Champions League Final
August 22, 2020
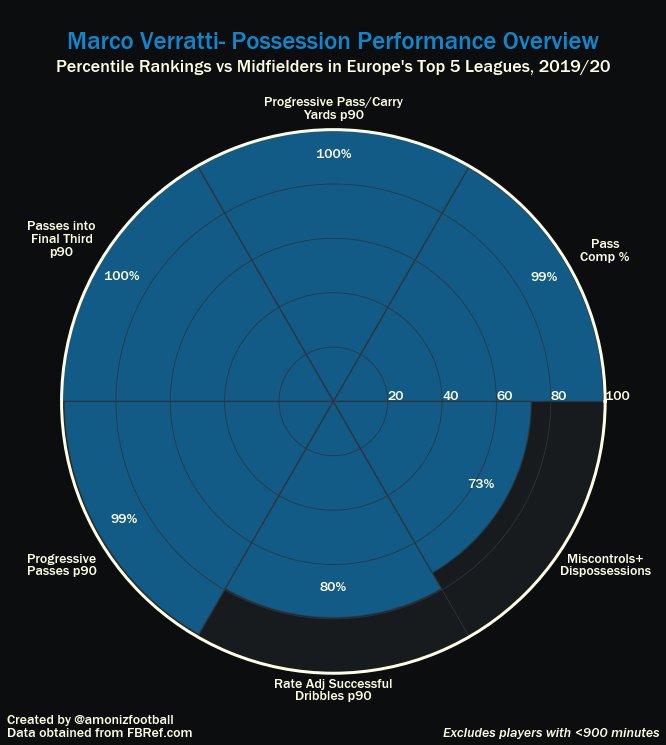
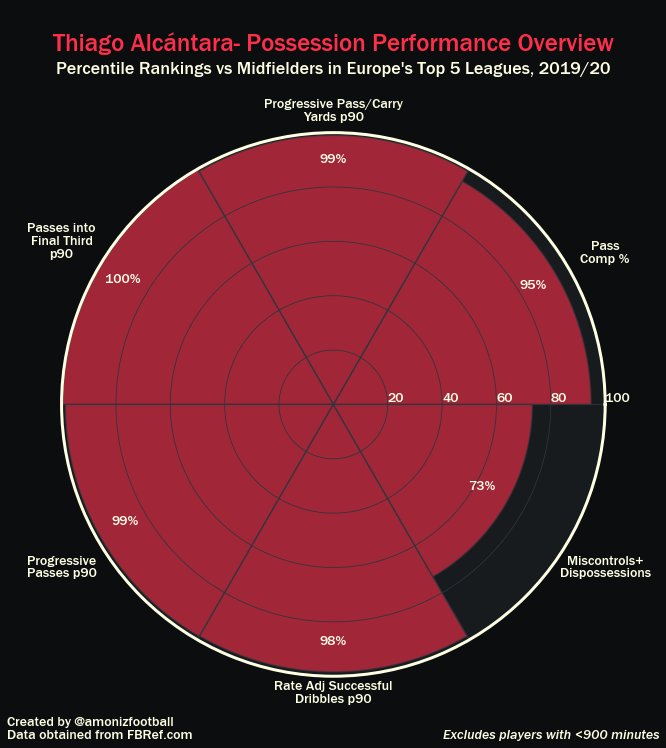
This year’s UEFA Champions League Final is home to the two most possession-dominant midfielders in world football this season; Bayern Munich’s Thiago Alcantara, and PSG’s Marco Verratti.
If rumours are to be believed, this will be Thiago’s last game for Bayern Munich, after he expressed interest in a new challenge away from the side that have won the Bundesliga every season since he joined in 2013.
Marco Verratti is a fitness doubt to start the final after missing the semi-final against RB Leipzig with an injury. His presence could be a huge factor for PSG in the final.
Made in NumPy, Pandas, Matplotlib, and Jupyter Notebooks
Expected Goals Performance: Why Mason Greenwood and Erling Haaland are unsustainably good finishers
August 19, 2020
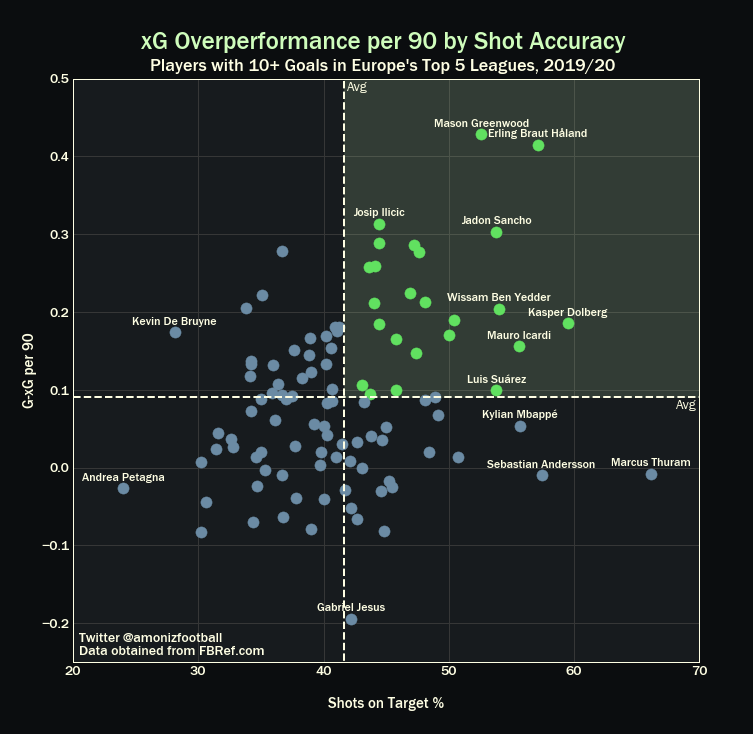
Expected Goals, or xG, is the study of the probability of a goal being scored given a shot, taking into account the height of the shot, location from which the shot was taken, and the number of defenders between the ball and the goal.
Thus, xG Overperformance measures how “clinical” a player is, comparing the overall quality of the chances a player receives with how many goals they score.
Here, xG overperformance is equated by the amount of minutes a player spends on the pitch. This method tends to reward players who take (and miss) a lot more low xG shots, which isn’t necessarily a bad thing, but is perhaps less literal a measure of how “clinical” a player is in the most literal sense than meausuring per shot.
Teenaged sensations Mason Greenwood and Erling Haaland are unsustainably good finishers and would have to be the two most clinical strikers in the game to continue to score at the rate they currently do.
Manchester City’s Gabriel Jesus is the worst xG performer in the double figures of goals from last season, despite being in the Top 5 players in Europe for xG generated per 90. Sergio Aguero, Manchester City’s other striker, who has similar xG per 90 but a much better finishing rate. This suggests that Jesus’ finishing last season was subpar but is also likely to regress towards the mean of 0 xG overperformance.
Overall, this graph shows that on average, players who achieve double figures in the Premier League generate positive xG overperformance per 90 minutes.
Made in NumPy, Pandas, Matplotlib, and Jupyter Notebooks
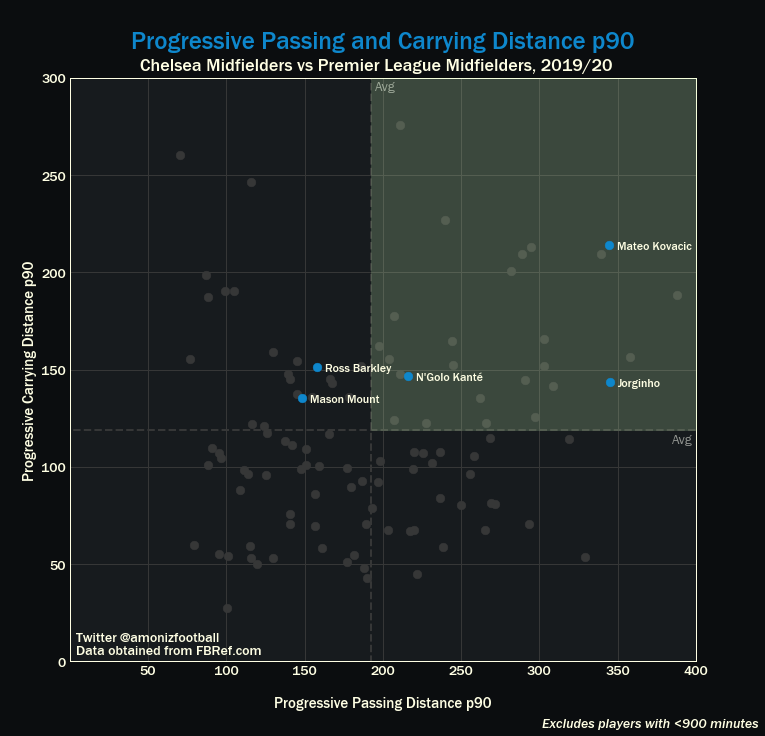
Article: Tableau Data Visualization- How good are Manchester United’s defenders and holding midfielders at progressive passing and carrying?
August 12, 2020
What if penalties were only worth half a goal?
August 10, 2020
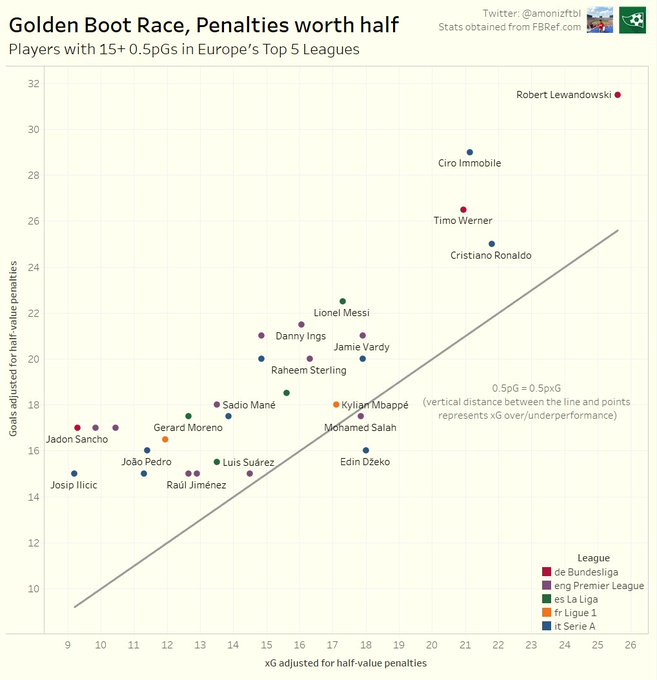
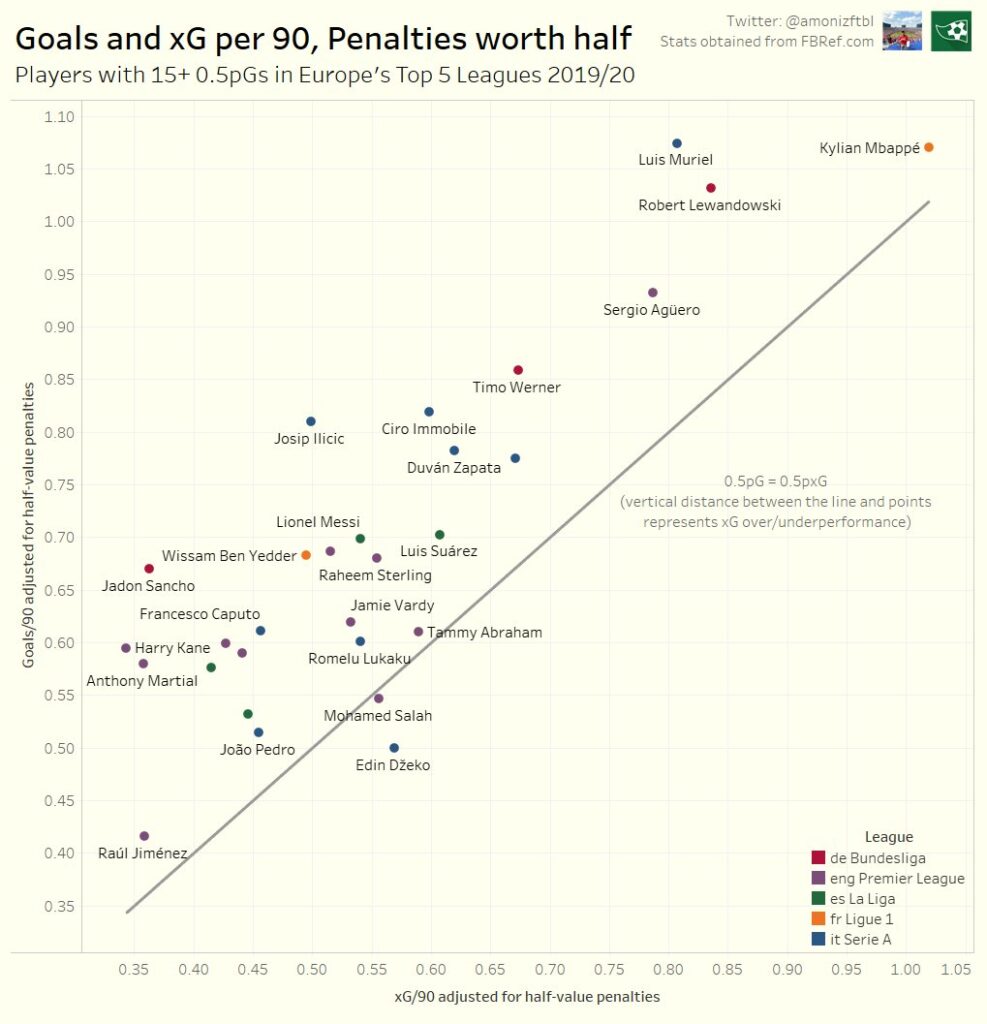
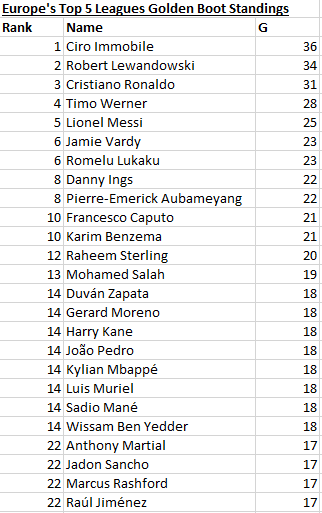
In this week’s episode of B/R Football Ranks, football journalist Sam Tighe argued that penalties should only be worth half a goal when counting which player scored the most goals in Europe’s Top 5 Leagues.
The argument he made, which has been heavily debated in the football analytics community for quite some time, is that penalties are chances with an extremely high 76% scoring chance for players who often did not win them.
Adjusting penalty goals and expected goals using FBRef.com’s football statistics database, I determined that penalties play a significant role in determining the outcome of the golden boot race.
Made in Tableau and Excel


