Tableau Dashboard: Rolling xG Trends of Premier League Teams, 17/18-20/21
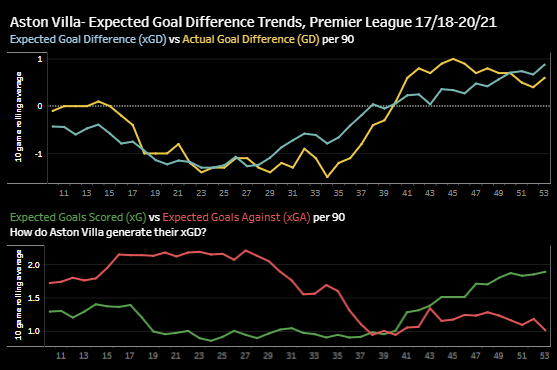
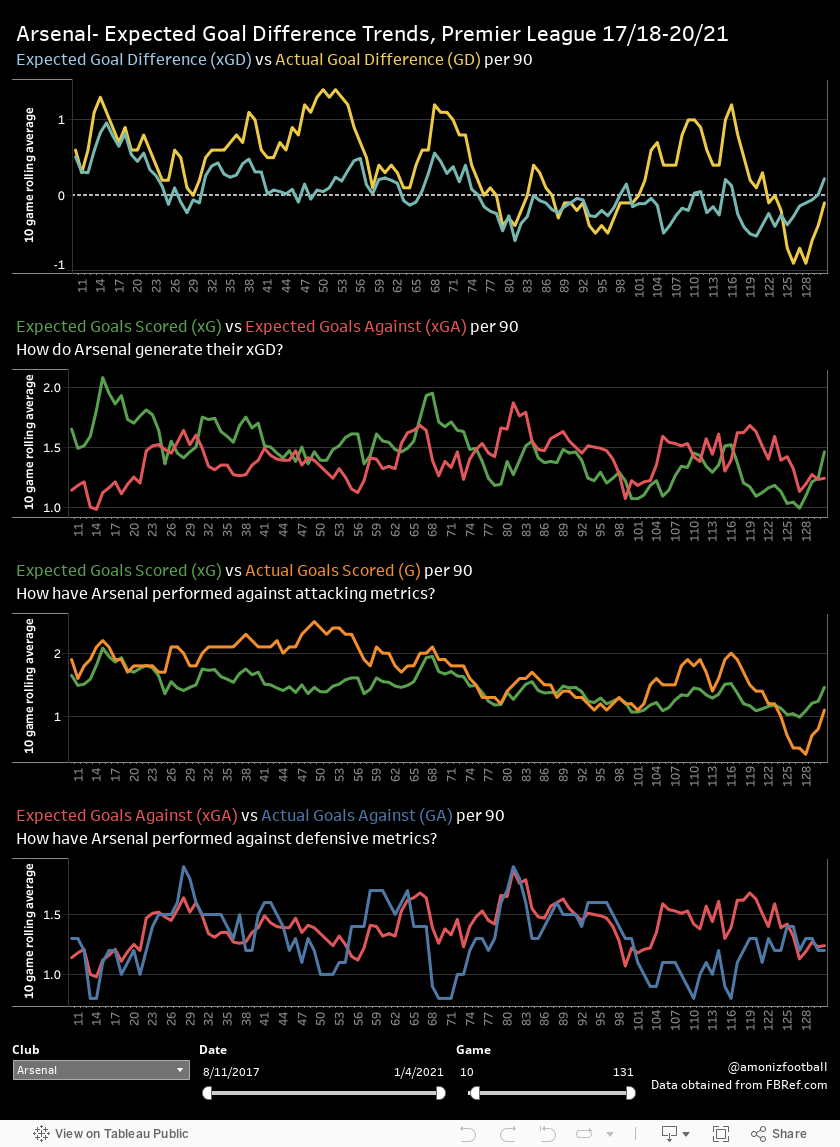
This weekend, I made an interactive dashboard in Tableau that presents a 10 game rolling average of @fbref‘s xG trends in the Premier League from 17/18-present. The dashboard allows you to choose a team and any range of dates/matches you’d like to see.
The dashboard will allow you to view/save an image containing 4 charts based on the filters you set. It will also adapt image size to your device. Thanks to @robertnhanson for helping inspire this last week- hoping to slowly improve it as I become better versed with Tableau!